Dynamic Dashboards, Powerful Insights
 Still stuck in spreadsheets? Or dealing with an obsolete reporting system? Your data deserves better.
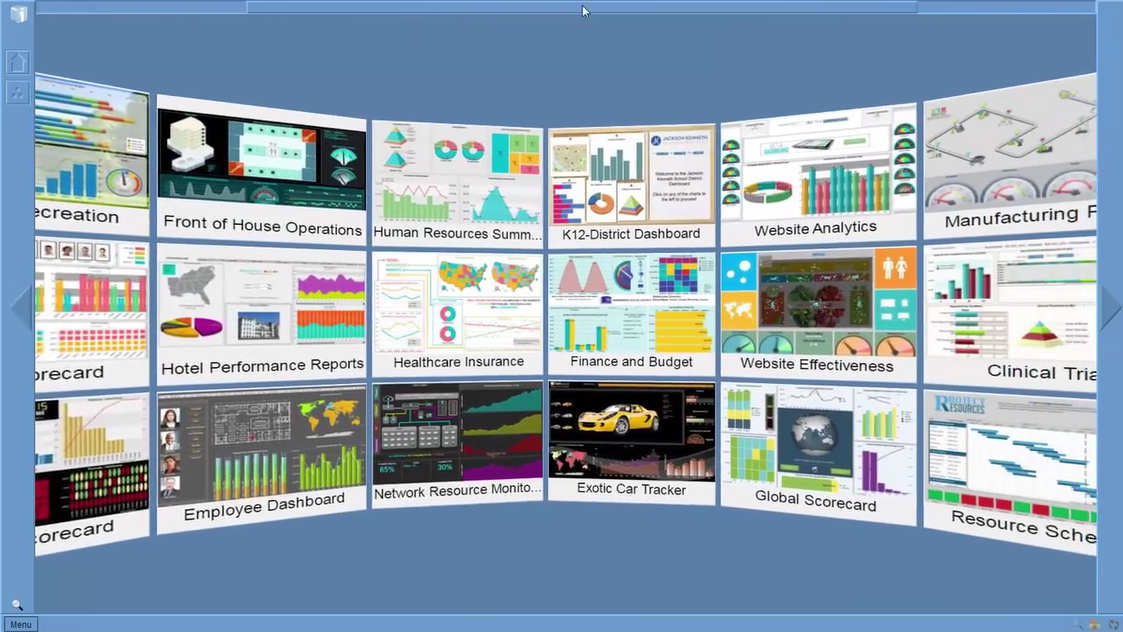
iDashboards delivers engaging, interactive charts, graphs, maps and infographics that are easy to create, easy to revise and easy to use.
It’s your data, re-energized.
Still stuck in spreadsheets? Or dealing with an obsolete reporting system? Your data deserves better.
iDashboards delivers engaging, interactive charts, graphs, maps and infographics that are easy to create, easy to revise and easy to use.
It’s your data, re-energized.
People react better to pictures than numbers. Thanks to our patented Interactive Intelligence interface, your dashboard graphics will be dynamic, engaging and, above all, easy to understand.
On-Premises Solution
 This version of iDashboards software resides on your server, behind your firewall, so your data and dashboards are easily accessible and become an integral part of your IT infrastructure.
Mobile Ready
Mobile users can view dashboards through devices running any web browser supporting full HTML5. As an alternative, Android tablets and iPad users can install the iDashboards Mobile app as a viewing application. Our apps are offered exclusively for licensed users of iDashboards Enterprise Suite software.
Display Solution
Our innovative software package helps you present dashboards to a wide audience on large displays in a slideshow view. Create team visibility in common areas such as lobbies, shop floors and conference rooms.
Blend & Consolidate Data With iDashboards Data Integrator
 Excel? SQL? Salesforce? Google? Facebook? They all fit. iDashboards easily connects your data, wherever it originates.
iDashboards Data Integrator (iDI) – our data blending solution – gives you the ability to consolidate data from multiple locations in diverse formats,
and transform it into a useful data set without the need for programming. iDashboards can handle data from a multitude of sources, including, but not limited to,
the options below. One of our representatives can assist you with a custom solution that’s right for your organization.
Excel? SQL? Salesforce? Google? Facebook? They all fit. iDashboards easily connects your data, wherever it originates.
iDashboards Data Integrator (iDI) – our data blending solution – gives you the ability to consolidate data from multiple locations in diverse formats,
and transform it into a useful data set without the need for programming. iDashboards can handle data from a multitude of sources, including, but not limited to,
the options below. One of our representatives can assist you with a custom solution that’s right for your organization.